Wondering which green technology examples are actually making a difference? Solar power, wind, electric vehicles, batteries and heat pumps lead the field, and falling costs are pushing them into mainstream use.
Each of these technologies sits inside the wider field of sustainability in business, where technology choices meet cost, risk and reputation.
| Item | Value |
|---|---|
| Solar PV capacity additions, first half of 2024 versus first half of 2023 | Up 36% |
| Electric cars sold worldwide, first half of 2024 | Around 7 million |
| Solar PV equipment prices, first half of 2024 | Down 20% |
| Grid-scale battery storage prices, first half of 2024 | Down almost 10% |
| Clean energy investment, 2023 | USD 1.8 trillion |
These figures come from the IEA’s November 2024 Clean Energy Market Monitor update and its March 2024 edition. They can change, so check the sources before you rely on them.
What counts as green technology?
A green technology cuts emissions or resource use while still doing a practical job, such as generating power, moving people or heating a building. The examples below have the strongest public data behind them, mostly from the IEA’s market tracking.
The money is already large: clean energy investment reached USD 1.8 trillion in 2023, according to the IEA’s Clean Energy Market Monitor from March 2024. Here is where the main technologies sit:
- Power: solar PV and wind.
- Transport and storage: electric vehicles and batteries.
- Buildings: heat pumps.
- Industry: cleaner steel, aluminium and ammonia, plus hydrogen electrolysers.
Solar and wind: the clearest green technology examples
Solar PV leads clean technology deployment. In the first half of 2024, new additions rose 36% from the first half of 2023, with the United States up 80%, according to the IEA’s update of 4 November 2024.
Falling prices are a big reason. Solar PV prices dropped by 20% in the first half of 2024 and wind turbine prices fell 5% over the last year, as the same IEA price index shows. In China, module prices more than halved in the last year, which also helped household and commercial customers save on electricity bills.
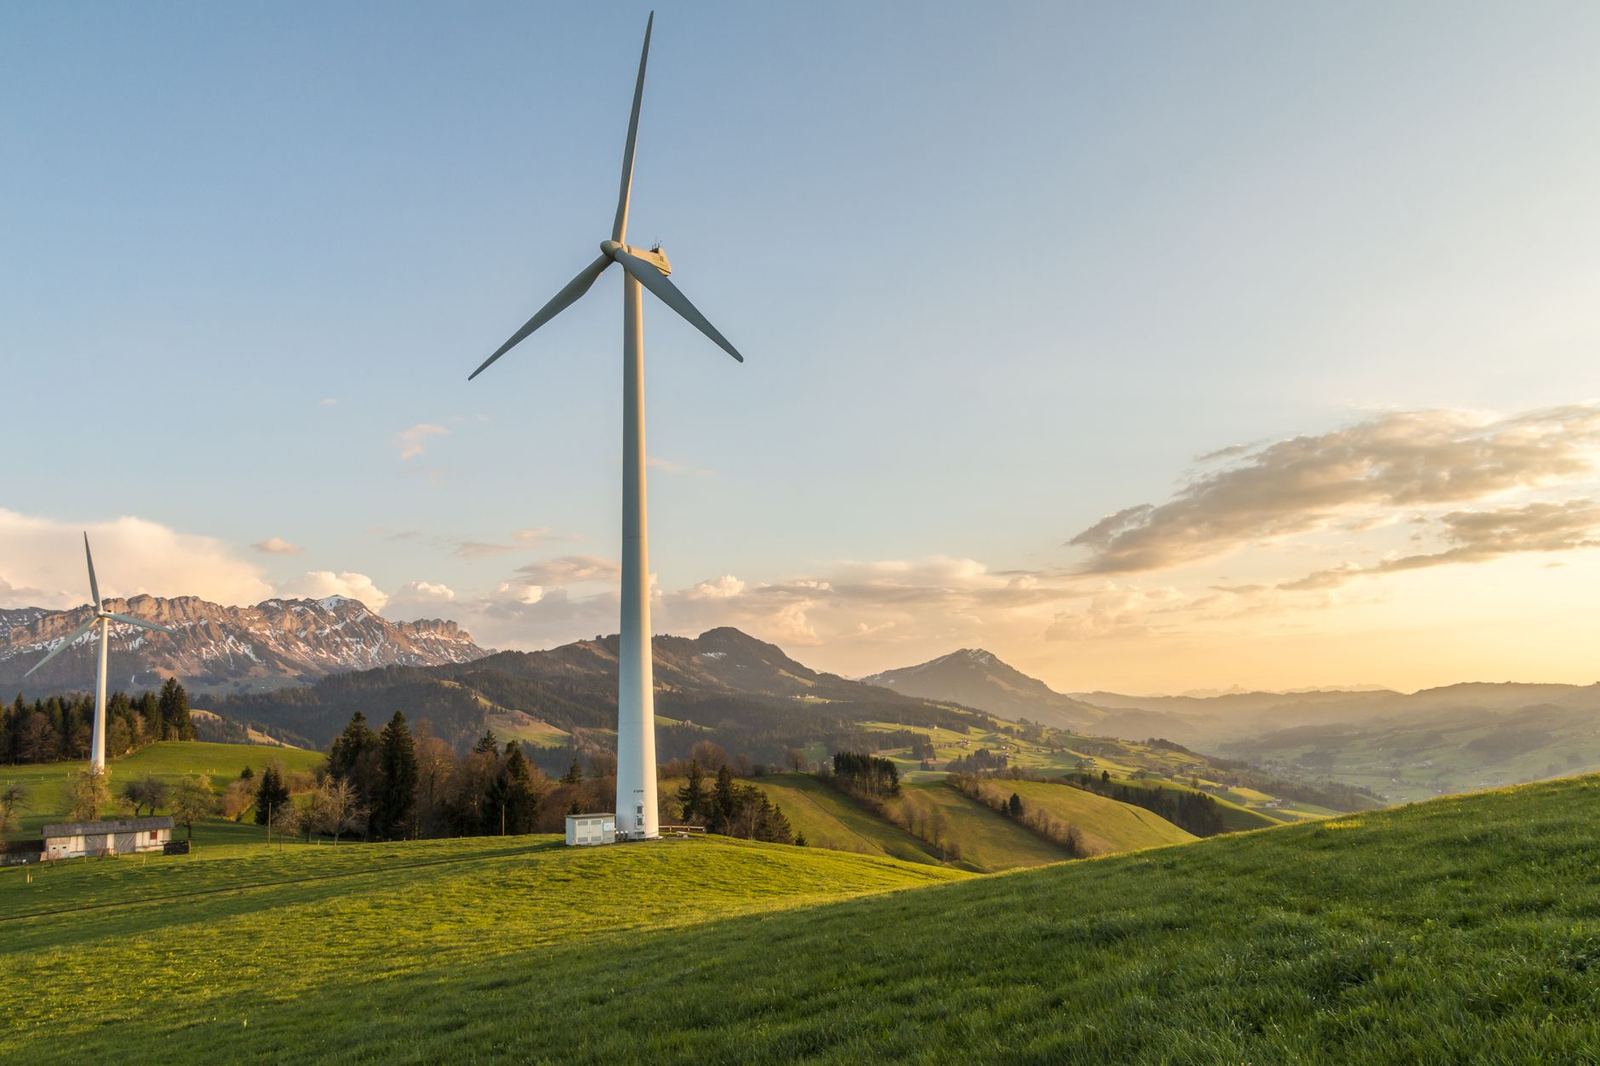
In 2023, annual additions of solar PV and wind grew 85% and 60% respectively, reaching almost 540 GW combined, according to the March 2024 Monitor. China and advanced economies took 90% of those additions, so the benefits remain concentrated.
Some other markets are catching up. Solar PV additions in India rose by 90% in the first six months of 2024, against more than 30% in China, per the November 2024 update.
Cleaner generation is starting to show in the data. In countries covered by the IEA’s Real-Time Electricity Tracker, power sector CO2 emissions were more than 1% lower in 2024 than at the same point a year earlier. Renewables supplied around half of European Union generation between January and October, while coal and gas combined fell to a record low 23% share in Europe, according to the same update.
Electric vehicles and batteries
Electric cars are the most visible example for most people. Sales grew around 35% in 2023, reaching 14 million vehicles, or one-in-five sales globally, per the March 2024 Monitor. Around 7 million were sold worldwide in the first half of 2024, per the November 2024 update.
The regional picture for the first half of 2024, from the same IEA update, is uneven:
- In China, electric vehicles made up nearly 45% of total car sales.
- In Europe, electric car sales grew by only 3% compared with the same period in 2023, held back by a significant drop in Germany.
- In other emerging market and developing economies, electric vehicle sales doubled compared with the same period in 2023.
Batteries sit behind both cars and power grids. Grid-scale battery storage prices decreased by almost 10% in the first half of 2024, and Chinese battery makers saw their profit margins strengthen, according to the IEA.
Heat pumps: a reminder that progress is uneven
Heat pumps show that falling costs alone do not guarantee growth. Global sales declined 10% in the first half of 2024, driven by lower sales in Europe, where they fell by almost 50%, per the IEA’s November 2024 update. Sales in China, the United States and Japan remained strong.
The slowdown began earlier. Global sales dipped marginally in 2023 from the record levels of 2022 as squeezed consumers avoided big-ticket purchases, according to the March 2024 Monitor. The IEA’s reading is that supportive policies matter, especially to narrow the gap between electricity and gas prices.
Cleaner industry, hydrogen and the money behind it
The race to bring near-zero emissions steel, aluminium and ammonia to market is underway, according to Energy Technology Perspectives. Deploying those technologies requires over USD 80 billion per year of investment on average through to 2050 in a net zero scenario.
The potential market for those materials is much larger. By 2050, it is poised to reach around USD 1.2 trillion, per the same report.
Hydrogen electrolyser capacity additions grew by 360% in 2023, but from a very low base, per the March 2024 Monitor. The same report tracks nuclear power: at the start of 2024, 58 reactors were under construction worldwide, with a total capacity of over 60 GW.
Under today’s policy settings, the market for solar PV, wind, electric vehicles, batteries, electrolysers and heat pumps is set to nearly triple by 2035 to more than USD 2 trillion, according to Energy Technology Perspectives.
Factories are following the demand. Global investment in clean technology manufacturing rose by 50% in 2023, reaching USD 235 billion, per the same report.
Energy efficiency is the weak spot. Energy intensity improved by around 1% in 2023, four times lower than the COP28 pledge to double the long-run rate of improvement by 2030, according to the IEA’s March 2024 Monitor.
Choosing green technology for your own organisation
Falling equipment prices create openings, but the IEA’s November 2024 update stresses that supportive policies and enabling investments, such as electricity grids and EV charging networks, are still needed. A sensible way to approach a decision is in order:
- Find where your energy use and emissions are largest.
- Check whether local grids, charging, incentives and rules support the technology.
- Compare total costs over the equipment’s life, not only the purchase price.
- Plan for what happens to equipment and materials at the end of their use.
Weighing each option against the triple bottom line of people, planet and profit keeps cost from being the only test. Many cleaner-technology choices also connect to a circular economy business model, where products are designed to be reused or recycled.
Frequently asked questions
Which technologies are the most common green technology examples?
Show answer
The IEA groups solar PV, wind, electric vehicles, batteries, electrolysers and heat pumps as key mass-manufactured clean energy technologies, as described in Energy Technology Perspectives.
Are green technologies getting cheaper?
Show answer
Mostly, yes. After a post-pandemic uptick, the IEA says clean energy equipment costs resumed their downward trend, with solar PV prices down 20% in the first half of 2024, as of its November 2024 update.
Why did heat pump sales fall?
Show answer
Sales fell 10% globally in the first half of 2024, driven by Europe, according to the IEA’s November 2024 update. The March 2024 Monitor links the earlier dip to consumers avoiding big-ticket spending and to the gap between electricity and gas prices.
Is clean technology growing equally around the world?
Show answer
No. In 2023, China and advanced economies accounted for 90% of capacity additions for wind and solar PV, per the March 2024 Monitor. Electric vehicle sales in other emerging markets did double in the first half of 2024, according to the November 2024 update.